Analysing the Impact of COVID-19 on Food Security
Using data from daily covid-19 cases, demographic distribution, grocery store mobility, and household surveys to understand food security in the face of COVID-19 across different clusters of the population.
This project was done as part of the 2-month IBM Hack Challenge 2020 . My team was declared one of the 7 winners out of over 10000 participants. Full code and additional details can be found here.
We conducted two levels of analysis:
- Price Elasticity- We understand how sensitive the demand is towards price changes, changes in quantity produced and other factors. This helps us understand how to reduce the supply demand gap for crops. Moreover, we add context using econometric predictions of the Indian Economy in 2020.
- Churn Analysis- Similar to traditional analysis, where we aim to understand which groups of people are likely to reduce the purchase of grocery items, which can help us identify vulnerable clusters in the population.
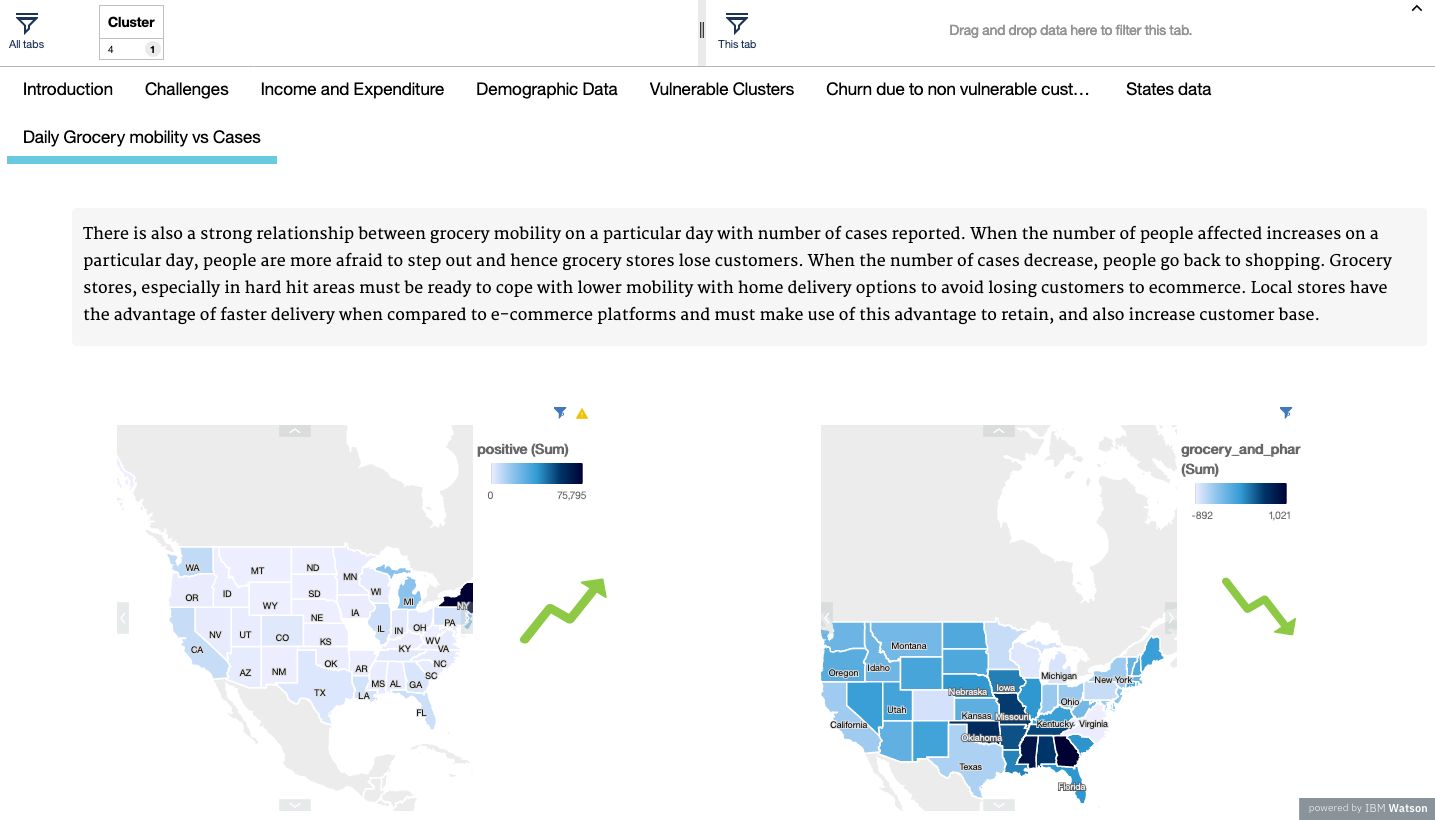
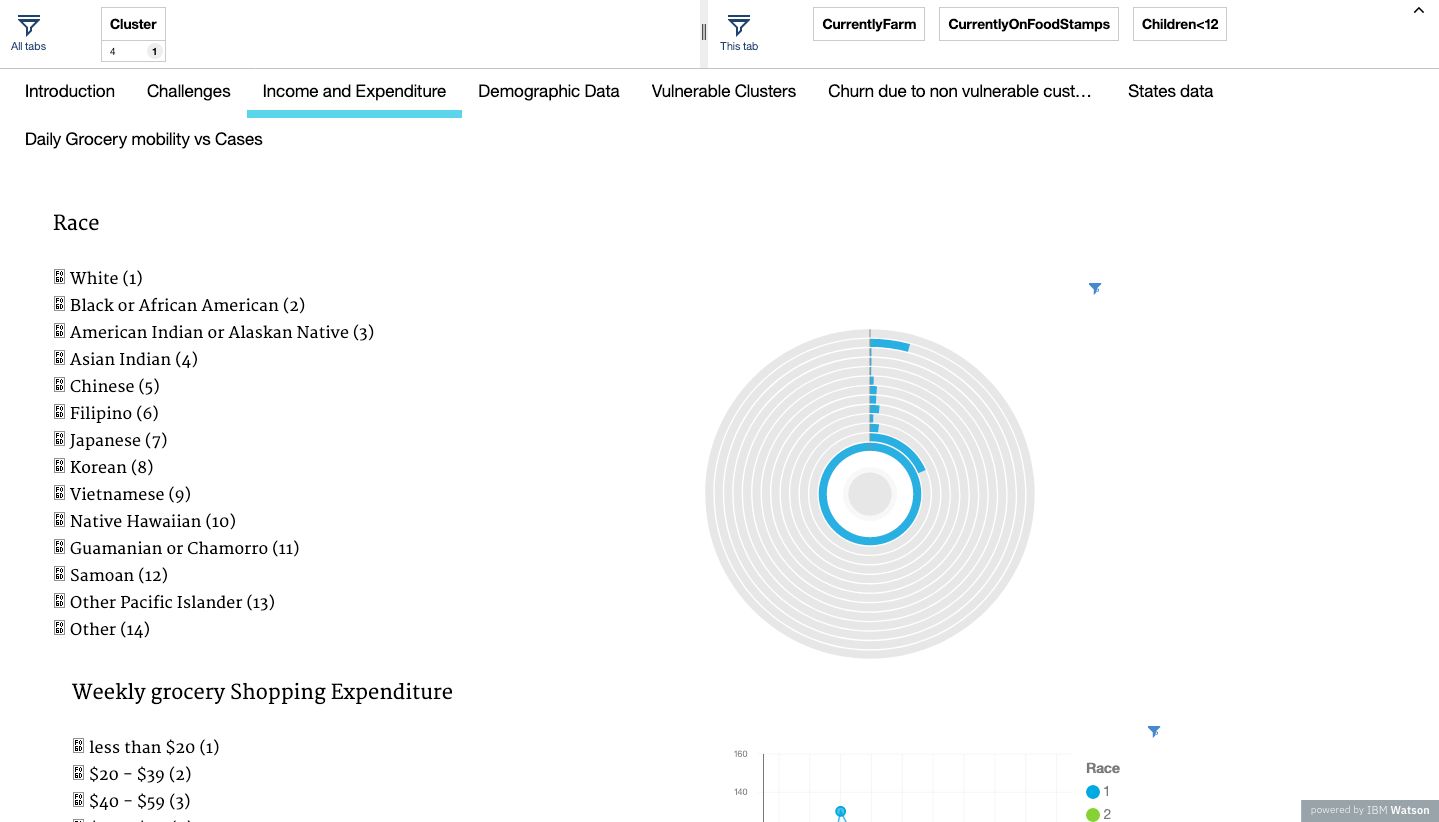
I worked primarily on Churn Analysis while my teammate worked on Price Elasticity. The data for churn analysis used was from a food demand survey of American households from 2013. It contained data about consumer preferences and challenges for food purchases, weekly grocery expenditure, weekly eating out expenditure, annual household income, family structure, race, education, age, food stamps, farming households, and many more columns. I also included data about daily covid-19 cases, daily grocery store mobility, and state-wise demographic data. This data was then clustered with dimensionality reduction techniques to identify vulnerable sections of the population. Below are some examples of the visualisation: